


Quick Answer
Solar panels reduce electricity bills by generating free power from sunlight, eliminating 50-90% of monthly utility costs depending on system size, location, and energy usage. Most homeowners break even in 6-8 years and save $10,000-$30,000 over 25 years. Installation costs $15,000-$25,000 before incentives, but federal tax credits and local rebates cut this significantly.
INTRODUCTION
Most people think solar panels are a luxury for wealthy homeowners. Here’s what nobody tells you: the average American family throws away $200-400 every month on electricity they could generate themselves for free.
I’ve watched people agonize over high electricity bills, switching providers, turning off lights obsessively, and running AC only at night—only to ignore the one solution that actually works: solar energy. The truth is, reducing electricity bills with solar panels isn’t complicated, expensive, or unreliable like it was 15 years ago. Modern solar systems are remarkably simple, affordable thanks to tax credits, and proven to deliver.
In this guide, you’ll discover exactly how solar panels slash your electricity costs, what homeowners actually pay and save, the critical mistakes people make before installation, and a step-by-step roadmap to get solar panels working for you—not against your budget. Whether you’re drowning in summer AC costs or winter heating bills, solar has become the most practical solution available. Let’s break down what actually works.
WHAT SOLAR PANELS REALLY DO (AND WHY MOST PEOPLE MISUNDERSTAND THEM)
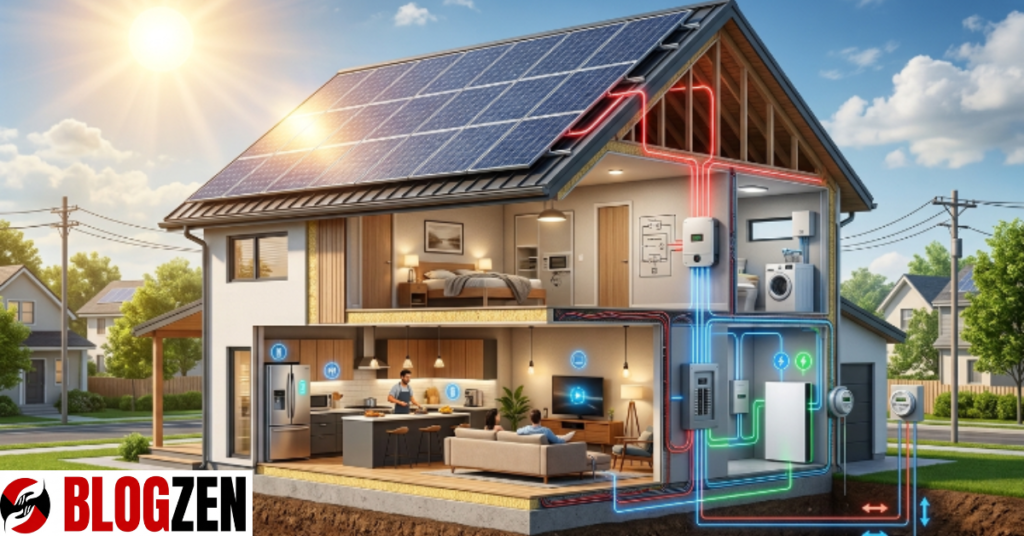
Solar panels don’t store energy in batteries (unless you add a battery system). They generate electricity directly from sunlight and feed it into your home in real-time. When the sun is up, your panels create power. When you turn on the coffee maker, air conditioner, or TV, you’re using that solar power first—before pulling anything from the grid.
Here’s the part most people get wrong: you’re still connected to the electrical grid. If your panels generate 6,000 watts during the day and you’re only using 3,000 watts, that extra 3,000 watts flows back to the grid, and your utility company credits you. This is called net metering, and it’s the reason solar works even when you use electricity at night.
Think of it this way: your solar panels are a personal power plant on your roof. When production exceeds your usage, you loan electricity to the grid and get paid back later. When the sun sets and you turn on lights, you’re drawing against your credits. No batteries needed. No complicated storage. The grid becomes your battery.
Most homeowners believe they need battery backup to make solar “worth it.” Wrong. Grid-connected solar without batteries saves you just as much money—sometimes more—because you avoid the $8,000-$15,000 battery cost while still getting all the financial benefits.
HOW SOLAR PANELS ACTUALLY REDUCE YOUR ELECTRICITY BILL
Your electricity bill has two main charges: the rate per kilowatt-hour (kWh) you use, and a fixed “base charge” for grid connection. Solar attacks the first number aggressively.
Here’s the math: If your utility charges $0.14 per kWh and you use 30 kWh per day (national average), you’re paying about $4.20 daily, or roughly $126 per month just for daytime usage. A 8-kilowatt solar system (common for homes in sunny regions) generates roughly 30-40 kWh on a clear day. In one year, a well-positioned system generates enough electricity to cover 70-90% of a typical home’s annual usage.
The reduction happens in multiple ways:
Direct offset: When your 8kW system runs during peak hours (10 AM-3 PM), it’s generating power at the exact moment electricity demand peaks and utility rates are highest. You’re avoiding these premium-priced hours. In many states, peak rates reach $0.30+ per kWh. Solar power beats that every time.
Net metering credits: Excess power flows to the grid. Utilities credit you at the full retail rate (this varies by state—some credit you 100%, others less). These credits roll over to nighttime usage and winter months when production drops. Over 12 months, net metering essentially lets solar “time-shift” your savings.
Reduced demand charges (for businesses): Commercial buildings pay extra based on their peak power draw. Solar smooths this spiky demand, cutting these charges significantly.
Protection against rate increases: Utility rates rise 2-3% annually on average. Once your solar system is installed, your power generation cost is locked at zero. After 25 years of grid rate increases, the value of that free electricity multiplies.
THE REAL COST: WHAT YOU’LL ACTUALLY PAY FOR SOLAR INSTALLATION
People obsess over the sticker price. Stop. What matters is the net cost after incentives.
A typical residential solar installation (6-8 kW system) costs $15,000-$25,000 before any incentives in 2024. This includes panels, inverter, wiring, labor, and permits.
Now apply the federal Investment Tax Credit (ITC): This is not a rebate—it’s a tax credit covering 30% of your total installation cost. If your system costs $20,000, you deduct $6,000 directly from federal taxes you owe. This credit is valid through 2032 (recently extended).
Many states offer additional incentives:
- California: Performance-based incentives and SGIP rebates up to $2,500
- Massachusetts: Massachusetts Solar Rebate Program covers up to 20% of costs
- New York: Residential Solar Tax Credit (25% of system cost)
- Texas: Property tax exemption on solar equipment value
After these incentives, the actual out-of-pocket cost drops to $8,000-$15,000 for most homeowners. Some in high-incentive states pay under $8,000.
“But I don’t have $10,000 lying around.” Three options exist:
- Solar loans: Borrow the cost, pay it back with monthly loan payments ($150-300/month). Your electricity savings exceed the loan payment, so you’re ahead immediately.
- Solar leases: Pay $200-400/month to lease panels for 20 years. You avoid upfront costs but don’t own the system or get tax credits.
- Power Purchase Agreements (PPAs): Pay only for electricity the panels generate ($0.10-0.15 per kWh—typically 30% below your utility rate). No upfront cost, zero maintenance.
Most people break even in 6-8 years. After that, electricity is free for another 17-19 years of the system’s 25-year lifespan.
| Installation Cost Scenario | Upfront Cost | After Federal Tax Credit (30%) | After State Incentives | Financed Monthly |
|---|---|---|---|---|
| $20,000 system | $20,000 | $14,000 | $10,000-12,000 | $150-180 |
| $15,000 system | $15,000 | $10,500 | $8,000-10,000 | $110-140 |
| $25,000 system | $25,000 | $17,500 | $12,000-15,000 | $180-220 |
COMMON MISTAKES PEOPLE MAKE WHEN INSTALLING SOLAR PANELS
Mistake #1: Undersizing the system to save money. People calculate their current electricity usage and install just enough panels to match it. Problem? They don’t account for future needs (electric car, heat pump, new appliances). A system that’s 20% oversized costs only 10% more and saves 30% more over time. Size for your realistic future use, not your current situation.
Mistake #2: Ignoring roof shade and orientation. Panels facing north are worthless in the Northern Hemisphere. Even partial shade for 2-3 hours reduces output 20-30%. A proper solar survey maps hourly shade from trees, buildings, and vents. Many installers skip this—ask for it explicitly. Shade issues often require relocating systems to a garage roof or ground mount. Don’t ignore this.
Mistake #3: Choosing the cheapest installer. Solar installation quality varies wildly. Poor electrical work creates fire hazards. Shoddy mounting fails in high winds. Bad permits delay connection. The difference between a $15,000 quote and a $22,000 quote might be licensing, insurance, and workmanship standards. Get three quotes, but prioritize licensed, insured, locally established companies.
Mistake #4: Not locking in the performance guarantee. Solar panels degrade at roughly 0.5% per year. A reputable installer warrants 80% output after 25 years. Cheap systems might not come with this guarantee. Panels with performance warranties cost $50-100 more but protect you against degradation defects.
Mistake #5: Overlooking interconnection delays. Many areas have 4-8 week approval processes with the utility before you can flip the switch to net metering. Plan for this. A contractor promises quick installation but then waits months for utility approval—you’re not saving money until grid connection is complete.
STEP-BY-STEP GUIDE: GETTING SOLAR PANELS THAT ACTUALLY SAVE YOU MONEY
Step 1: Calculate your real electricity needs.
Pull your last 12 months of utility bills. Add up total kWh used and dollars spent. This is your baseline. If you plan to add an electric vehicle or heat pump, estimate the added load. Most solar calculators assume flat usage, but home energy needs shift seasonally and yearly.
Step 2: Get your roof inspected and evaluated.
Solar requires 5-7 hours of peak sunlight daily to be worthwhile. Sites in the far north (Seattle, Portland, Minnesota) still benefit but need larger systems. Get a professional solar assessment that measures your roof’s actual shade profile, structural integrity, and orientation. This costs $100-300 but prevents $20,000 mistakes.
Step 3: Get three quotes from local installers.
Use EnergySage, SolarReviews, or local recommendations. Demand quotes that include the 30% federal tax credit math and local incentives. Compare not just price but equipment brands, warranty terms, and timeline. Ask each installer: “What happens if I need maintenance? How quickly can you service this system?” A contractor 50 miles away is less useful than a local shop.
Step 4: Check your state’s net metering policy.
Not all states offer 1:1 net metering. Some credit you 75%, others 50% of retail rates. Some cap the size of systems or require batteries. Confirm your state’s rules before signing. This dramatically affects your ROI calculation.
Step 5: Lock in incentives and financing.
Federal tax credits and state rebates expire or change. Check if your state has an incentive deadline. If financing, compare solar loans (typical 4-6% APR) against leases or PPAs. Calculate whether you want to own the system (higher upfront, higher long-term savings) or lease (no upfront cost, monthly payment, lower total savings).
Step 6: Complete permitting and inspections.
Your installer typically handles this, but confirm. Most jurisdictions require electrical permits ($50-300) and building permits ($100-500). Inspections are free. Timeline: 1-3 weeks typically.
Step 7: Schedule interconnection with your utility.
Once your system is physically installed and inspected, your utility must approve grid connection. This activates net metering. Timeframe varies: 1-4 weeks in most areas, longer in congested regions. Once approved, your electricity starts flowing to the grid and being credited.
REAL-WORLD SAVINGS: WHAT HOMEOWNERS ARE ACTUALLY SAVING
Case Study 1: Sarah in North Carolina
Situation: $145/month electricity bill, single-story home, all-electric heat pump.
System: 7 kW, cost $18,500 before incentives, $13,000 after federal tax credit and state rebate.
Financing: $200/month solar loan over 7 years.
Result: First year savings: $1,800. After loan is paid off, $1,800/year in free electricity. 25-year savings: $38,000.
Case Study 2: Marcus in California
Situation: $320/month bill (high peak rates in summer), family of four, AC running heavily.
System: 10 kW, cost $24,000 before incentives, $12,000 after federal credit and California SGIP rebate.
Financing: Outright purchase, no loan.
Result: First year savings: $4,200 (California peak rates are 2x national average). Year-round cash flow positive. 25-year savings: $92,000. System paid for in 3 years.
Case Study 3: David in Ohio
Situation: $110/month bill, modest home, winter heating costs significant.
System: 5 kW, cost $14,000 before incentives, $9,500 after federal credit.
Financing: Solar lease, $250/month lease payment.
Result: Electricity savings: $90/month. Lease cost: $250/month. No net savings in year 1. But: no maintenance worries, no repair costs, guaranteed equipment replacement. After 10 years, utility rates likely 25-30% higher, making the fixed lease payment look cheap. 20-year total cost: lower than buying, but not by much.
The pattern: Buying solar saves more over time, but leasing is better if you value simplicity and zero maintenance. Most homeowners who can afford to buy should buy. Most who want peace of mind should lease.
MYTHS VS. FACTS: WHAT NOBODY TELLS YOU ABOUT SOLAR EFFICIENCY
Myth: “Solar panels don’t work when it’s cloudy.”
Fact: Panels work in cloudy conditions, just at reduced efficiency. A cloudy day produces 25-50% of a sunny day’s output. This is still valuable. Modern systems account for seasonal and weather variation—that’s why installers calculate annual output, not peak output. Your system produces every day of the year, rain or shine.
Myth: “I need batteries to make solar worth it.”
Fact: Batteries add $8,000-15,000 to a system and are unnecessary in areas with good net metering. The grid acts as your “battery” free of charge. Batteries only matter if you want backup power during outages or your utility doesn’t offer net metering.
Myth: “Solar panels only last 10 years.”
Fact: Modern panels last 25-30 years with 80%+ output. Degradation is slow—0.5%/year typically. An inverter (the device converting DC to AC power) lasts 10-15 years and costs $2,000-3,000 to replace. Over the system’s lifetime, you might replace one inverter. That’s it.
Myth: “I’ll lose money if I sell my home with solar.”
Fact: Homes with solar sell for 4% more, on average, than comparable homes without. Buyers see it as a utility cost reduction. Ensure your system is owned, not leased (leased systems transfer to the new owner if they’re creditworthy, or you must pay off the lease—complicating sales). With owned systems, you’re sitting on a $10,000-20,000 asset that buyers want.
Myth: “Solar installers are all the same. Just pick the cheapest.”
Fact: Quality varies dramatically. A licensed, insured, well-reviewed installer with ties to the community ensures proper electrical safety, code compliance, and future service availability. Cut-rate installers might skip inspections, rush work, or disappear if problems arise. The cheapest isn’t the best savings—it’s the most expensive gamble.
CONCLUSION
Reducing electricity bills with solar panels is no longer a luxury investment—it’s become the most practical financial move for homeowners tired of climbing utility costs. Here’s what actually matters:
Solar panels reduce your bill by 50-90% depending on system size and location. You break even in 6-8 years and save $10,000-$30,000 over the system’s 25-year lifespan. The federal tax credit (30% of system cost) and state incentives dramatically cut the upfront burden, dropping real out-of-pocket costs to $8,000-$15,000 for most homes.
The biggest mistakes are undersizing systems, ignoring shade, choosing poor installers, and overlooking your state’s net metering rules. A single wrong decision here costs thousands in lost savings.
Real homeowners are saving $1,800-$4,200 annually (varies by location), and many see positive cash flow in year one after accounting for loan payments.
The only question left is: Are you waiting for electricity costs to rise another 20%, or are you taking control today? Start with a free solar assessment from a local installer. It costs nothing and shows you exactly what you’d save. The math has never been more compelling.
FAQs
How much can I realistically save with solar panels?
Most homeowners save $10,000-$30,000 over 25 years, with annual savings of $1,200-$3,000 depending on system size, location, and current electricity usage. Those in high-rate states like California, Hawaii, or New York see savings of $3,000-$5,000 annually. A 7 kW system in an average-sun region saves approximately $1,500-$2,000 per year after year six (when the loan is paid off or benefits fully materialize). Calculate your specific savings by multiplying your current monthly bill by 0.60 (assumes 40% reduction)—this gives a rough first-year savings estimate.
How long does it take to break even on solar panel costs?
Break-even typically occurs in 6-8 years. This accounts for system cost minus federal tax credits, state incentives, and annual electricity savings. If you financed with a loan, break-even means the loan is fully paid and you’re now getting free electricity. If you purchased outright, break-even means you’ve recovered your initial investment through savings. Systems in sunny regions (Arizona, California, Florida, Texas) break even in 5-6 years. Systems in cloudier regions (Pacific Northwest, Northeast) break even in 8-10 years. After break-even, you enjoy 15-20 years of essentially free electricity.
Do solar panels work when it’s cloudy or rainy?
Yes, solar panels generate electricity on cloudy days, though output is reduced to 25-50% of sunny-day capacity. Rainy days produce less than cloudy days, but still generate usable power. This is why installers calculate annual production averages rather than peak-case scenarios. A typical system generates positive output nearly every day of the year. Only during extreme weather (heavy snow coverage, extended cloudy periods) does production drop significantly—but even then, you’re drawing against credits accumulated on sunny days.
What happens to my electricity bill if I produce more power than I use?
Your excess power flows to the electrical grid, and your utility credits you at the retail electricity rate—this is called net metering. These credits roll over month to month and carry year-round, essentially letting solar “time-shift” your savings. Summer overproduction credits offset winter usage when production drops. Over 12 months, net metering ensures you pay only for any net electricity consumed beyond your panels’ annual output. Some states credit excess power at 100% retail rates; others credit 50-75%. Confirm your state’s policy before signing—it significantly impacts your ROI.
How much does solar panel installation actually cost after incentives?
Full system costs range from $15,000-$25,000 before incentives. Apply the federal tax credit (30% of total cost) and your state’s available rebates, and net costs typically drop to $8,000-$15,000. Many states offer additional incentives: (1) Performance-based rebates ($1,000-$3,000), (2) Property tax exemptions on solar value, (3) Sales tax exemptions. High-incentive states like California, Massachusetts, and New York can reduce real out-of-pocket costs to under $8,000. Three financing options help: (1) Solar loans at 4-6% APR ($150-250/month), (2) Solar leases ($200-400/month, no upfront cost, no ownership), or (3) Power Purchase Agreements ($0.10-0.15 per kWh generated). Most people finance systems through loans because ownership locks in long-term savings.
What size solar system do I need to eliminate my electricity bill?
Size is calculated by dividing your annual kWh usage by your area’s annual peak-sun hours (PSH). If you use 12,000 kWh annually and your region gets 1,400 PSH yearly, you need: 12,000 ÷ 1,400 = 8.6 kW system. Regional peak-sun hours vary widely: Arizona (1,600-1,800 PSH), Texas (1,400-1,600), California (1,500-1,800), Northeast (1,100-1,300). Most homeowners install systems sized to cover 80-90% of their usage, not 100%, because oversizing adds cost without proportional benefit. A professional solar assessment calculates this precisely based on your roof’s shade, orientation, and local weather patterns.
